Six tips for the Chrome Developer Tools
If you've done any web development, you're probably familiar with the Chrome Developer Tools and how handy it is for debugging those nasty css/js bugs.
You're probably familiar with the bread and butter of the toolbar - inspect element, css tweaking, setting breakpoints in the JavaScript etc. So instead of going through those, I'm going to list a five tips here that you may not yet know and will hopefully make your debugging experience slightly less painful.
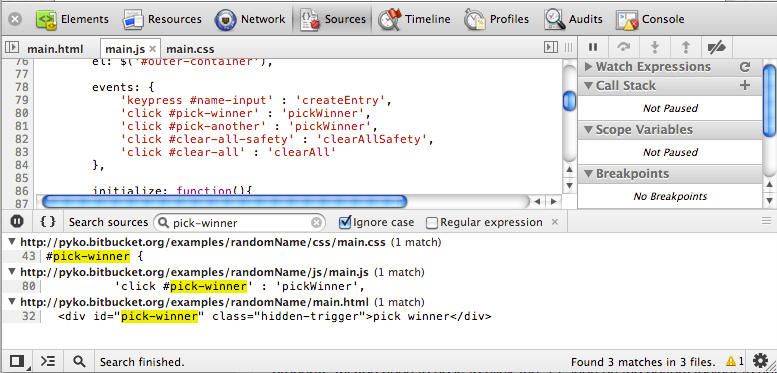
1. Super search: Cmd + Opt + F (Mac) / Ctrl + Shift + F (Win)
This shortcut is super useful for the times when you just do a massive "search all" to find a keyword across all your files. It will search through all your source files - html, css, js :) Once you've found what you were looking for, click on the search results to jump to the corresponding file.
2. Dock the toolbar on the right/bottom - the easy way
By default, the dev toolbar docks at the bottom and opens in a new window if you need more screen real estate for debugging. I personally don't like opening the toolbar in a new window - more than one debug session and it's easy to get lost between the windows. Depending on the page layout, what you're debugging etc you may want more vertical space than horizontal... introducing docking the toolbar to the right!
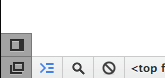
The easiest way is to long-press the bottom left button and select the 'dock to right' icon. You'll notice when the toolbar is docked to right, the icon will change to 'dock to bottom'. You can now easily toggle between dock on bottom and right by clicking on that icon. If you do ever want to open the toolbar in a new window, just long press on the icon and choose the 'new window' icon.
3. Clear console: Cmd + K (Mac) / Ctrl + L (Mac/Win)
This shortcut clears the contents of your console - useful when you've got a lot of debug stuff in your console and want to clear it out so there is less stuff to get in the way. You can also type "clear" as a command, but two keystrokes is much better than six.
4. Open/close the console: Esc (Mac/Win)
The console is very useful, but sometimes you want to hide it. Alternatively you might be inspecting an element when you want to open the console for a bit of sanity checking. If your hands are already on the keyboard, just hit the "Esc" key when you've got focus on the developer toolbar and it will open/close the console.
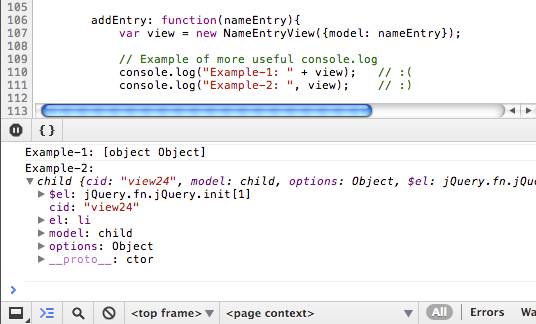
5. console.log("foo" + bar) vs console.log("foo", bar)
Using console.log("foo " + bar) is primitive, but definitely useful. This works if you're after the value of the variable; but being told that bar is an Object - [object Object] isn't all that helpful when debugging.
However, if you use a comma instead of a plus, Chrome Dev Tools will very kindly print the object and let you inspect the object instead :)
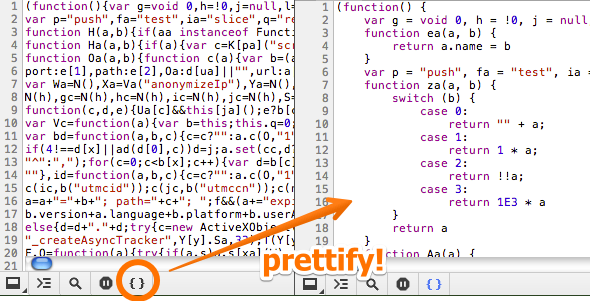
6. Make minified code suck less (ie. slightly more readable)
Unfortunately there comes a time when you'll be debugging and you'll step into some minified code which is pretty much completely uncomprehensible. Luckily, you can make the minified code slightly prettier by adding some formatting at the click of a button! The magic button to click is the one that looks like a pair of parenthesis: { }
The variable and function names may still make your head hurt, but at least you can now set breakpoints and make educated guesses as to what is going on.